
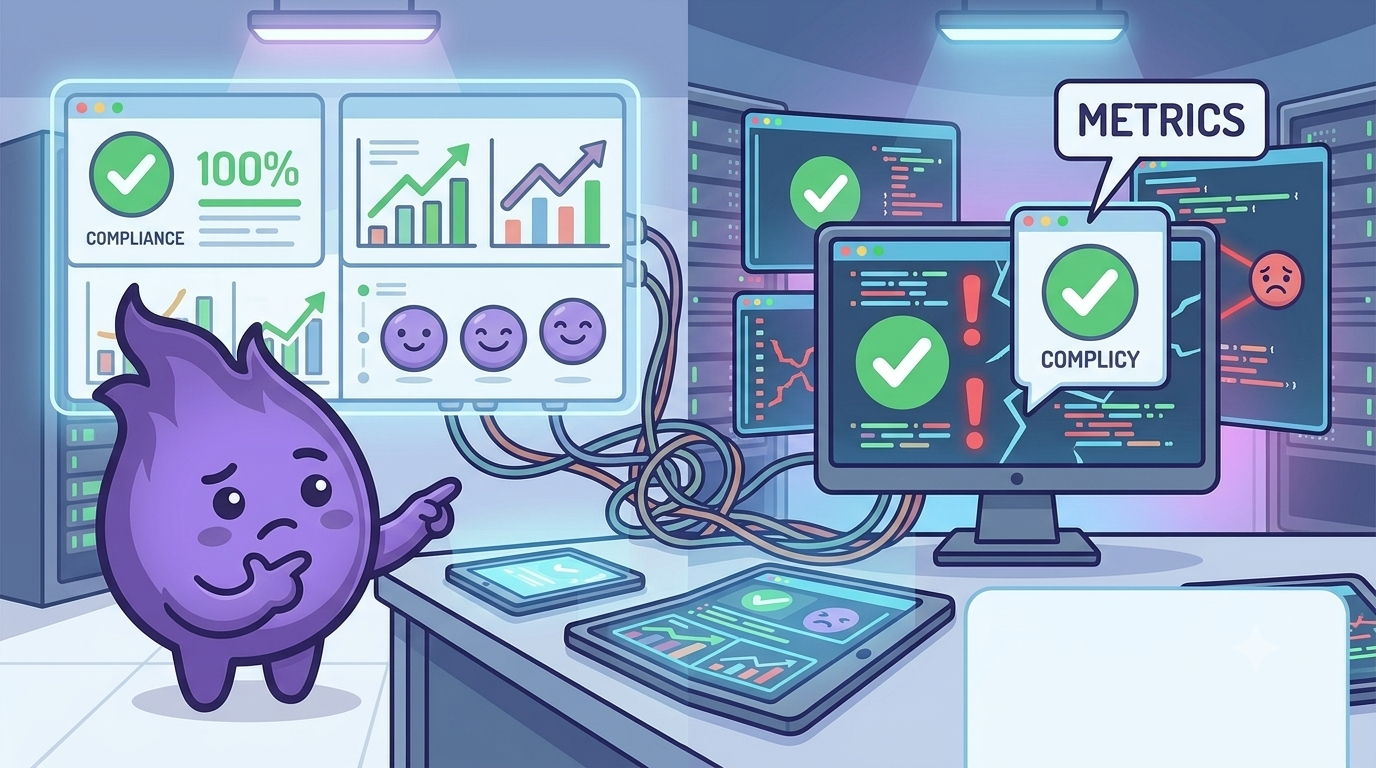
When digital compliance metrics give the wrong impression
On paper, everything looks perfect. Compliance is at 95 percent. All ePRO forms are submitted. Reminders are firing. No outstanding queries. But behind the numbers, something else might be happening: something the dashboard does not show.
Digital compliance metrics are useful. They help surface issues early, provide structure, and keep study teams on track. But they are only as honest as the context around them. In some trials, metrics drift away from the real experience of participants. They start to reflect task completion, not genuine engagement.
Consider the participant who taps through a symptom diary each day without reading the questions. From the system's perspective, they are compliant. But the data may be meaningless. The same entry submitted ten days in a row is unlikely to reflect a dynamic clinical state. Without deeper review, it passes as valid. This isn't a fringe concern either: a study of internet-based quality of life assessments using attention-check items found that around 7.4% of respondents could be classified as careless responders, submitting technically complete answers without meaningfully engaging with the questions. Reliability scores for the instrument barely moved. What broke down was validity: the ability to detect real differences between groups who should have looked different on paper.
That distinction matters more than it sounds. A compliance dashboard is built to catch missing data, and careless responding doesn't look missing. It looks perfect. The same study found that statistical techniques originally designed to flag inconsistent test-taking, known as person-fit statistics, could meaningfully separate careless responses from genuine ones even when nothing else in the data looked unusual. That's a strong argument for building a similar layer of scrutiny into ePRO monitoring rather than trusting completion rates alone.
Warning patterns worth watching for
These signals do not always indicate a problem. But they are worth investigating:
- High-frequency, low-variance entries. Identical scores across consecutive days often suggest rote behaviour or fatigue rather than stable health.
- Unrealistic completion times. A 20-question form submitted in under 30 seconds probably was not read carefully.
- Batch submissions. Five days of data entered in a single session may indicate that reminders were ignored until a deadline loomed.
- No questions from a site. Silence can mean things are running smoothly. It can also mean the team is confused and not sure who to ask.
What to do about it
The solution is not to discard digital dashboards. It is to pair them with monitoring that looks for meaning rather than just completion:
- Set flags for data that looks too perfect, not just data that is missing
- Review how long forms were open, not just whether they were submitted
- Look at the time of submission: forms routinely completed at midnight may reflect a batch-entry habit
- Ask why a participant who started strong has become oddly consistent across weeks
From a site perspective, qualitative input matters too. If a coordinator says "this participant is struggling" but their metrics are clean, that is worth listening to. They may be catching something the system cannot, in the same way a person-fit statistic catches something a raw completion count never will.
Compliance as a starting point, not a verdict
A high compliance rate tells you that tasks were completed. It does not tell you that data is trustworthy, that participants are engaged, or that the study is running as intended.
Treating compliance as a starting point rather than a verdict is a small shift in mindset. But it tends to surface the kind of problems that only become visible in analysis if no one caught them earlier, by which point the option to intervene has usually already passed.